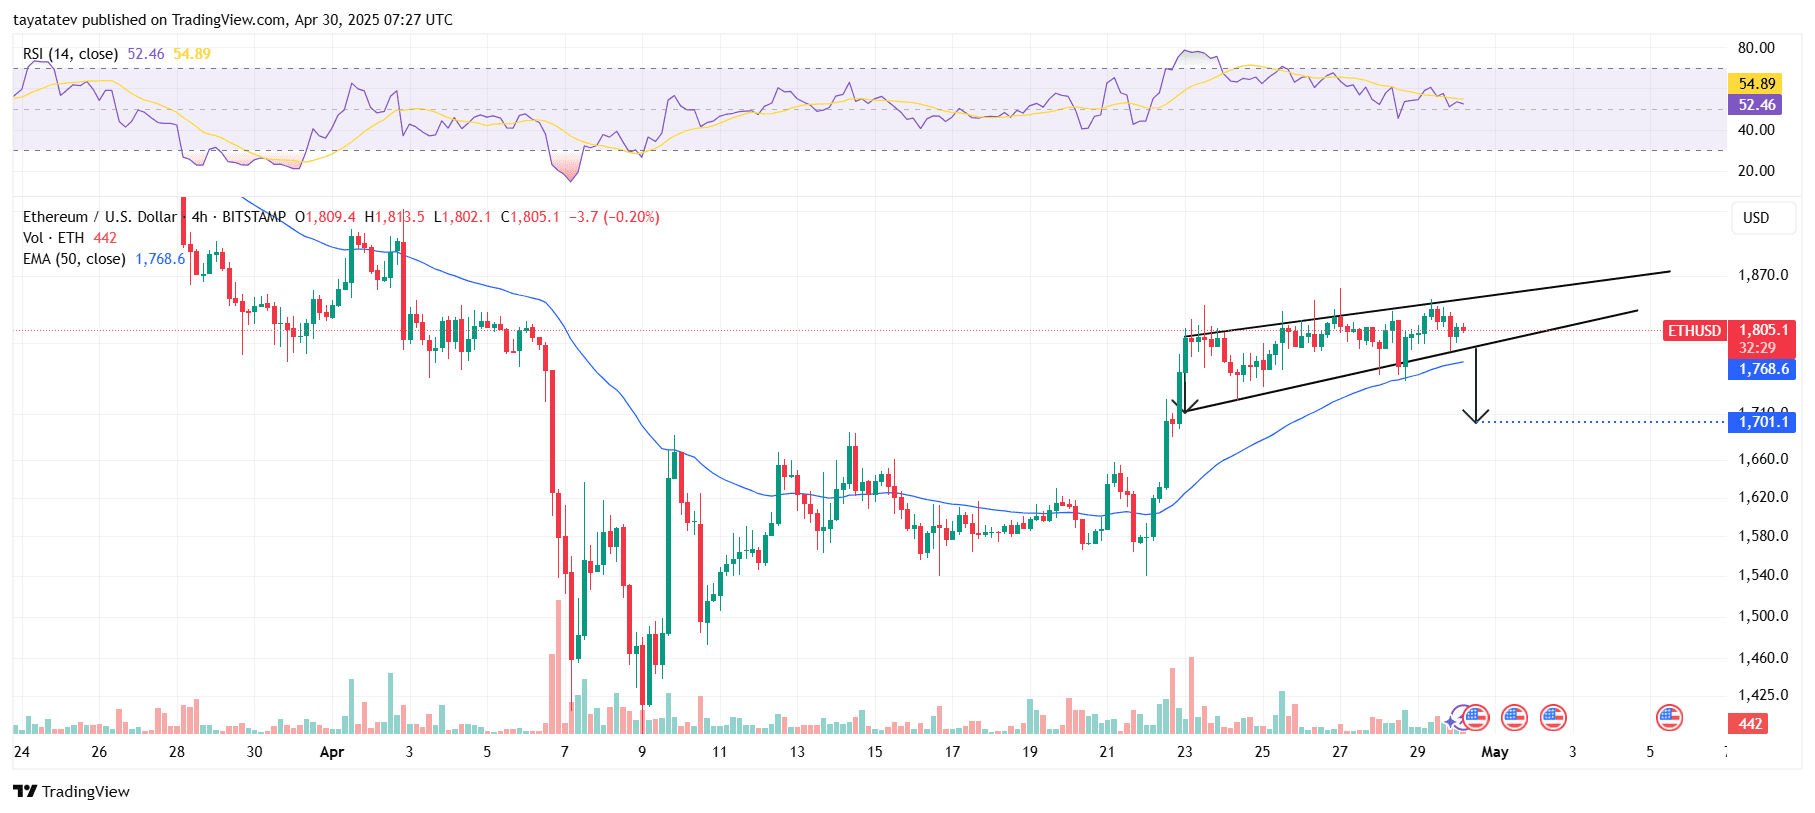
A rising wedge is a bearish chart pattern that forms during an uptrend, marked by higher highs and higher lows within converging trendlines, often signaling weakening momentum and a potential reversal.
From April 23 to April 30, 2025, Ethereum climbed inside this wedge, with the upper boundary now near $1,870 and the lower support around $1,768, where the 50-period Exponential Moving Average (EMA) also aligns.
However, the structure appears to be losing strength. The Relative Strength Index (RSI) dropped from over 60 on April 27 to 52.46 on April 30, while the price continues to hug the lower wedge support. Volume has also remained subdued since April 25, weakening the bullish case.
If ETH breaks below the wedge and 50 EMA support near $1,768, it could fall toward the projected target of $1,700, a 6% drop from the current price of $1,805.1.
Ethereum’s ADX Plunge Signals Weakening Trend Strength
Ethereum’s DMI chart shows that the strength of its trend is fading fast. The Directional Movement Index (DMI) is a technical indicator that helps show if a trend is strong and who controls the market—buyers or sellers. It has three parts: the ADX (which shows trend strength), +DI (which measures buying pressure), and –DI (which measures selling pressure).
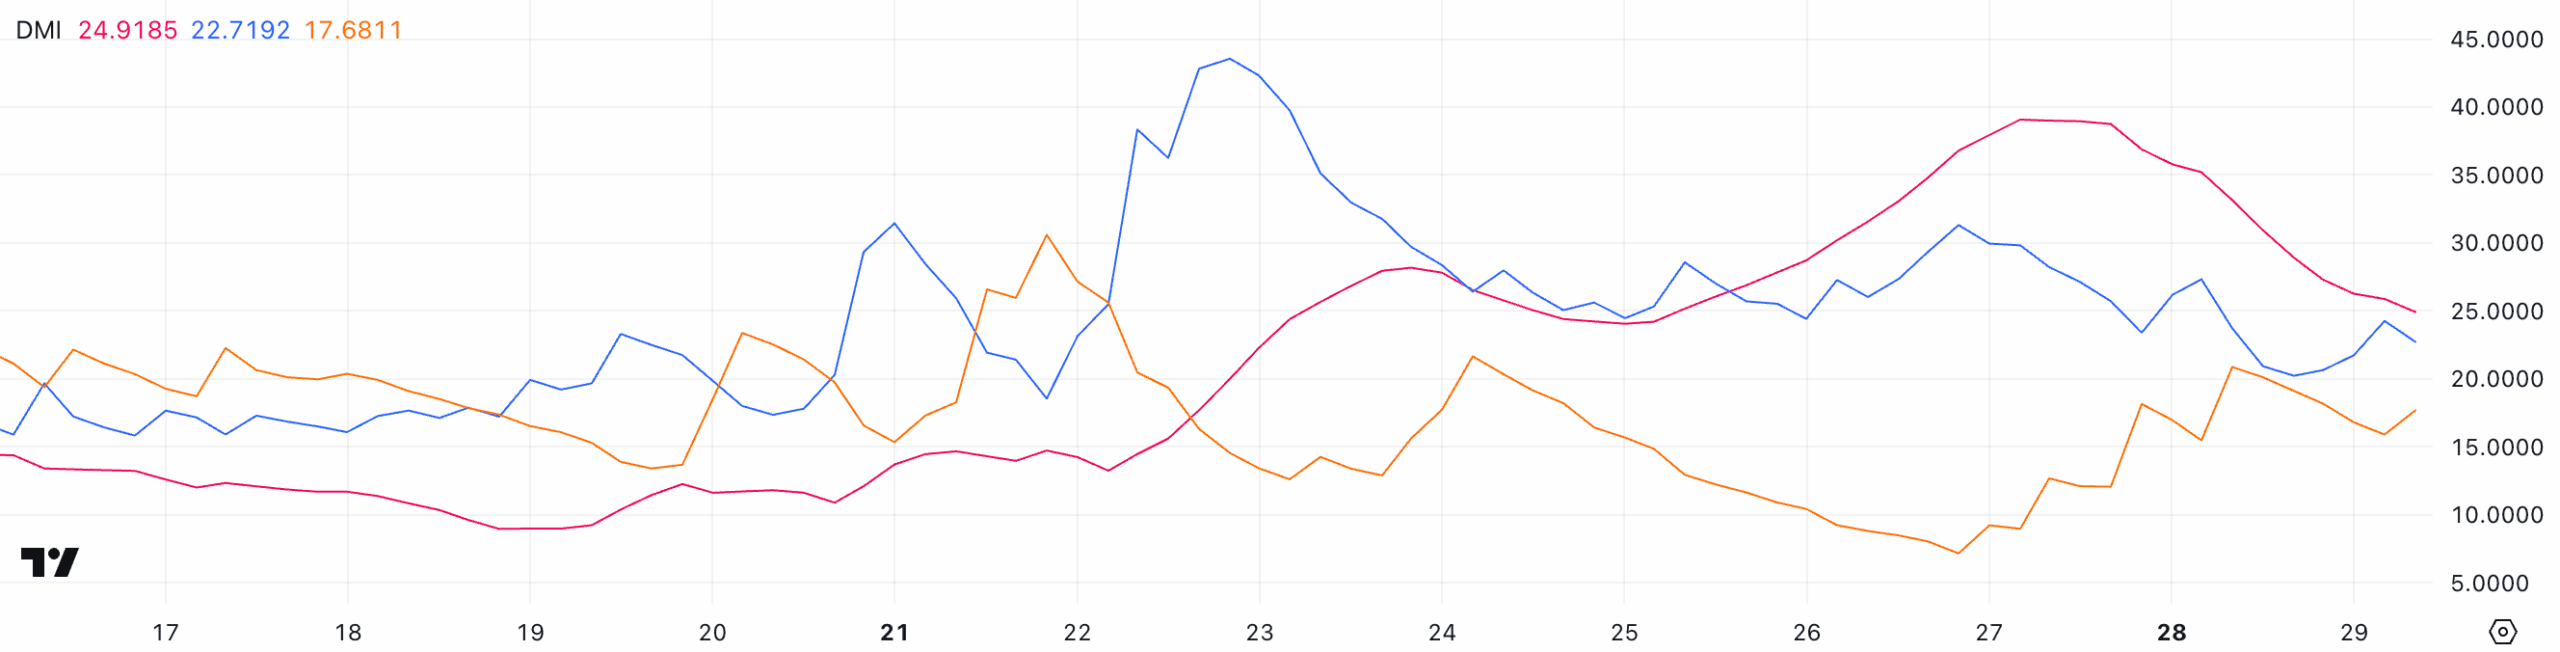
This steep fall in ADX shows that Ethereum’s recent momentum is weakening. If strong buying or selling doesn’t return soon, the price could keep moving sideways with more ups and downs.
At the same time, the other parts of the DMI show that control is shifting. The Positive Directional Indicator (+DI), which tracks buyer strength, has dropped steadily, from 31.71 three days ago to 27.3 yesterday and now to 22.71. This means buying pressure is slowing down.
Meanwhile, the Negative Directional Indicator (–DI), which tracks seller strength, is rising. It climbed from 7.16 three days ago to 15.64 yesterday, and now to 17.68. On April 29, the +DI and –DI lines almost touched—+DI at 20.91 and –DI at 20.1. That shows sellers were nearly as strong as buyers and might soon take control.
With sellers gaining strength and the trend weakening, Ethereum could face more downside. If buyers don’t step back in, ETH may struggle to find a clear direction or drop further.
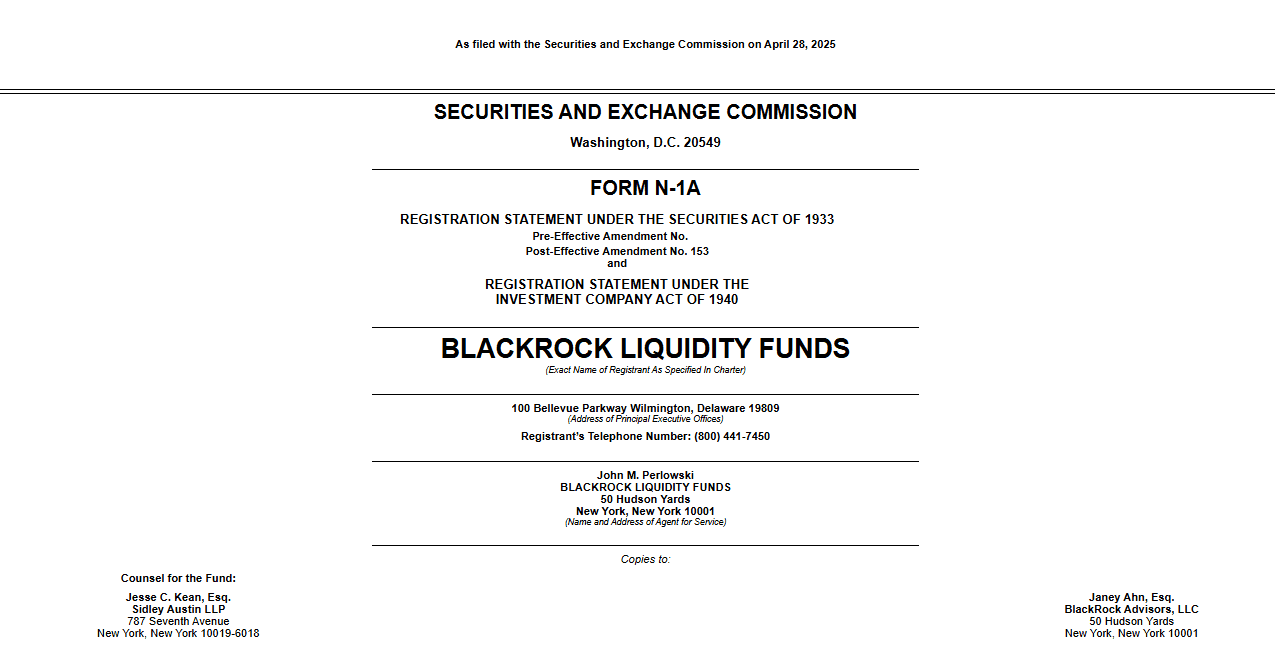
BlackRock’s $150B Treasury Tokenization Marks Milestone for Ethereum
Meanwhile, Ethereum secured a major victory as BlackRock moved to tokenize its $150 billion Treasury Trust Fund. According to an April 28 filing with the U.S. Securities and Exchange Commission (SEC), BlackRock plans to launch a new “DLT Shares” asset class that uses blockchain to track ownership.
Former Ethereum developer Eric Connor reacted on April 30, calling it “the biggest real-world asset flow to Ethereum yet.” He added,
“Ethereum just scored a monster win.”
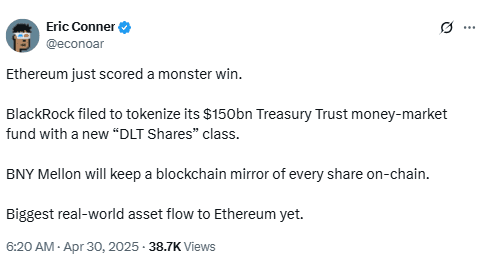
Moreover, BlackRock chose Ethereum as the settlement layer for its tokenized assets, reinforcing the network’s position as the industry standard for real-world asset (RWA) tokenization. The Treasury Trust Fund, which invests in short-term U.S. Treasuries, aims to deliver stable returns with low risk and low fees. The new DLT shares will operate via BNY Mellon to ensure secure blockchain-based ownership tracking.
Ethereum Solidifies RWA Dominance as BlackRock Doubles Down on Tokenization
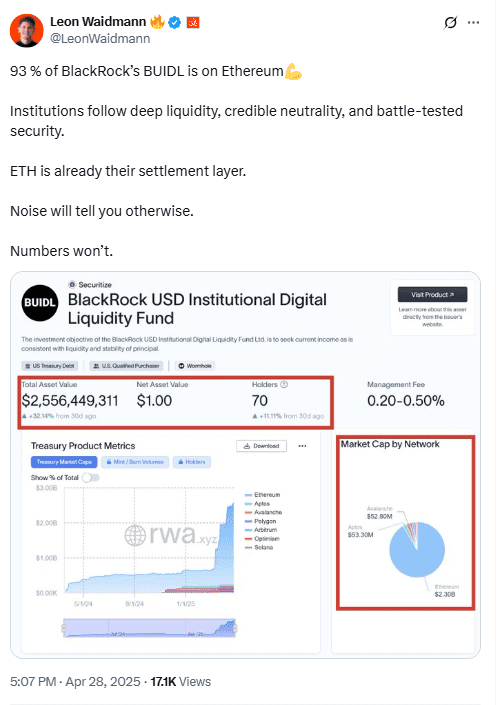
Previously, BlackRock launched the USD Institutional Digital Liquidity Fund (BUIDL) on Ethereum in collaboration with Securitize.
This fund allows qualified investors to earn yield from tokenized U.S. Treasuries, according to RWA.XYZ. The BUIDL fund currently holds $2.34 billion in assets, 93% of which are on the Ethereum network.
Additionally, Onchain Foundation’s head of research, Leon Waidmann, noted that Ethereum’s deep liquidity and security make it the go-to settlement layer for institutions.
“Institutions follow deep liquidity, credible neutrality, and battle-tested security,”
he explained.
Researcher CryptoGoos echoed this sentiment, saying
“BlackRock is building on Ethereum. They’re betting on ETH as the leading ecosystem.”
He also claimed that Ethereum remains “extremely undervalued.”
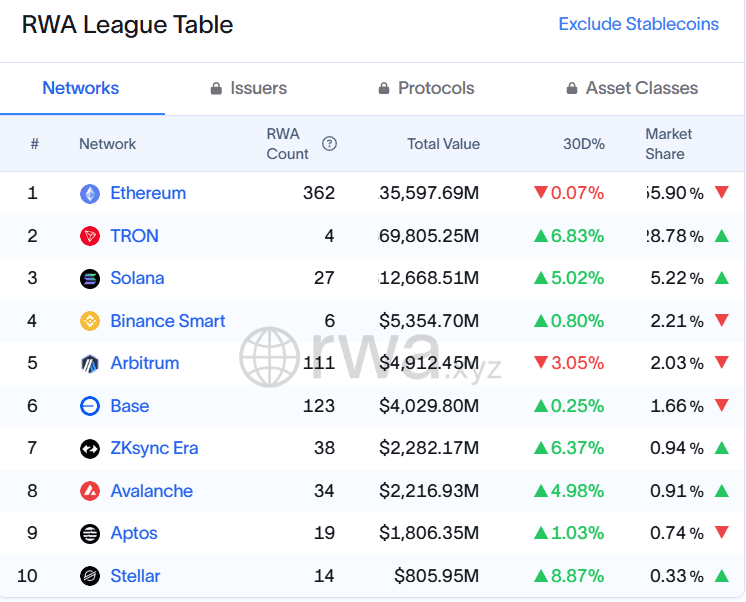
Currently, Ethereum leads the RWA tokenization market with near 56% dominance and $6.2 billion tokenized on-chain, excluding stablecoins, based on data from rwa.xyz.


